


 23/08/2024
 0
0 When it comes to interactive data visualization in JavaScript, one of the most critical features is the ability to zoom and pan within charts seamlessly. These functionalities are pivotal for users who need to navigate through extensive datasets and focus on specific data ranges.
- Demo
- Enlarge
- Reload
- New window
Free iPage Web Hosting for First Year NOW
If you're still looking for a reliable web host provider with affordable rates, why you don't take a little of time to try iPage, only with $1.89/month, included $500+ Free Extra Credits for the payment of 24 months ($45)?
Over 1,000,000+ existisng customers can not be wrong, definitely you're not, too! More important, when you register the web hosting at iPage through our link, we're going to be happy for resending a full refund to you. That's awesome! You should try iPage web hosting for FREE now! And contact us for anything you need to know about iPage.
In this article, we will learn about the advanced zooming and panning capabilities in JavaScript charts, drawing insights from a developer’s perspective to highlight how these features enhance user experience and data interaction.
The Importance of Zooming and Panning in Data Visualization

image by devexpress.com
In any application that deals with large datasets, the ability to zoom in and out and pan across the data is essential. These features allow users to:
- Focus on Details: Zooming in on specific areas of the chart helps users analyze finer details and make more precise observations.
- Understand Trends: Panning across the chart enables users to explore different sections of the dataset, helping them to identify trends and patterns that may not be apparent when viewing the entire dataset at once.
- Improve Usability: These interactive features make the chart more user-friendly, providing a dynamic way to interact with the data rather than a static display.
Implementing Zooming and Panning in JavaScript Charts
Implementing zooming and panning in JavaScript charts can be complex, requiring careful consideration of performance and responsiveness. A well-designed charting library should provide robust APIs that allow developers to add these functionalities with ease. Here’s how an advanced JavaScript charting library approaches this challenge:
Zooming Capabilities:
- Zoom to Rect: This allows users to select a rectangular region on the chart to zoom into. This method is intuitive and provides precise control over the zoom area.
- Mouse Wheel Zoom: Users can zoom in and out using the mouse wheel, which is a natural and convenient interaction for many users.
- Pinch to Zoom: For devices that can be touched, pinch movements can be used to zoom in and out. This is a common way for mobile users to connect with apps.
Panning Functionalities:
- Drag to Pan: Users can click and drag the chart to pan across the data. This interaction mimics the way users navigate through maps and other large canvases.
- Keyboard Navigation: Arrow keys can be used to pan the chart, providing an alternative to mouse interactions.
Dynamic Range Adjustment:
- Auto-Scaling: As users zoom and pan, the chart can automatically adjust its axes to fit the visible data, ensuring that the chart remains informative and well-scaled.
- Programmatic Control: Developers can set the visible range programmatically, allowing for custom zoom and pan behaviors based on specific application requirements.
Performance Considerations
Performance is a key concern when implementing zooming and panning, especially with large datasets. Advanced charting libraries leverage technologies such as WebGL and WebAssembly to ensure smooth interactions. These technologies allow the chart to offload rendering tasks to the GPU, providing a significant performance boost.
- WebGL: Utilizes the GPU for rendering, enabling high-performance graphics and smooth transitions during zooming and panning.
- WebAssembly: Enhances the performance of critical operations, ensuring that large datasets can be processed efficiently without compromising interactivity.
Enhancing User Experience with Annotations and Tooltips
Zooming and panning are often complemented by features such as annotations and tooltips. These additions provide contextual information that enhances the user experience:
- Annotations: Developers can place annotations on the chart at specific data points or regions, providing additional context or highlighting important information. Annotations can be interactive, allowing users to click and learn more about a particular data point.
- Tooltips: As users zoom and pan, tooltips can provide instant feedback about the data under the cursor, offering details without cluttering the chart with too much information.
Case Study: Financial and Stock Charts
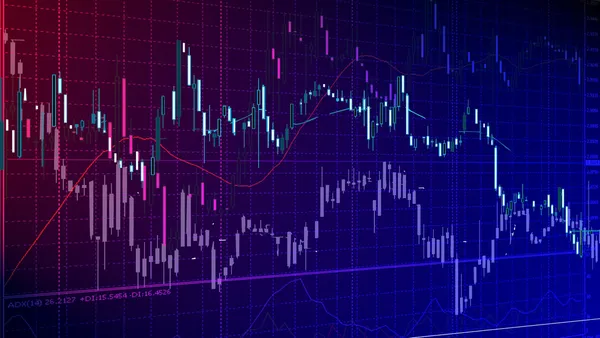
image by depositphotos.com
Financial and stock charts are prime examples of where advanced zooming and panning capabilities are crucial. Traders and analysts often need to zoom into minute-by-minute data and then pan out to see longer-term trends.
- Candlestick Charts: These charts benefit greatly from zooming and panning, as they display detailed information about price movements over short periods.
- Linked Charts: Multiple charts can be linked together, so zooming or panning one chart synchronizes with others. This is particularly useful in financial applications where different metrics need to be compared simultaneously.
Real-Time Data and User Interaction
In applications dealing with real-time data, the ability to zoom and pan without disrupting the data flow is critical. Advanced charting libraries support real-time updates, ensuring that the chart remains responsive even as new data points are added. This is achieved through:
- Efficient Data Handling: The charting library must efficiently handle incoming data, updating the visible range dynamically while maintaining performance.
- Smooth Transitions: As new data comes in, transitions should be smooth to avoid jarring the user experience. This includes animating changes in zoom level or panning position.
Customizing the Zoom and Pan Experience
Customization is key to meeting the specific needs of different applications. Advanced charting libraries provide extensive customization options, allowing developers to tailor the zoom and pan experience:
- Custom Zoom Levels: Developers can define specific zoom levels that make sense for their data, ensuring that users can quickly access the most relevant views.
- Restricted Panning: In some applications, it may be necessary to restrict panning to certain areas of the chart. This can be easily implemented through customizable APIs.
- User Interface Integration: Zooming and panning controls can be integrated into the user interface, providing buttons or sliders that give users additional ways to interact with the chart.
Future Trends in Zooming and Panning
As technology evolves, so do the capabilities of charting libraries. Future trends in zooming and panning are likely to include:
- AI and Predictive Analytics: Integrating AI to predict and automatically zoom into areas of interest based on user behavior.
- Augmented Reality (AR): Using AR to provide immersive data exploration experiences where users can navigate through data in a 3D space.
- Voice Controls: Implementing voice controls for zooming and panning, making data interaction more accessible and hands-free.
In conclusion, advanced zooming and panning capabilities are essential for modern JavaScript charts, enhancing the user experience and enabling detailed data analysis. By leveraging technologies such as WebGL and WebAssembly, and providing extensive customization options, developers can create powerful and interactive data visualizations. As we look to the future, integrating AI, AR, and voice controls will further revolutionize how users interact with data, making these features even more indispensable.
Author
 Phong Thai is a Web Developer, Web Coder for 20 years with PHP, JavaScript, CSS. He is the creator of JavaScriptBank.com - provide thousands of free JavaScript code examples, web development tips and tricks, helpful blogging guides.
Follow him on twitter@js_bank or connect with him on facebook@jsbank if you want. His websites for your knowledge: javascriptON.com, inOneSec.com, www.gomymobi.com
- Sent (0)
- New
Generate your business videos by AI with voice or just text
chatGPTaz.com
Talk to ChatGPT by your mother language
AppAIVideo
Your first FREE AI Video App
Deepfake Video
Deepfake AI Video Maker
Deepfake
Deepfake AI Video Maker
AI Deep Fake
Deepfake AI Video Maker
AIvidio
AI Video Mobile Solutions
AIvideos
AI Video Platform & Solutions
AIvedio
AI Video App Maker
Faceswap AI Online
Swap Faces Video, Photo & GIFs Instantly with Powerful AI Tools - Faceswap AI Online FREE
Faceswap AI Online
Swap Faces Video, Photo & GIFs Instantly with Powerful AI Tools - Faceswap AI Online FREE
Temu Free $500 for New Users
Claim Free Temu $500 Credit via Affiliate & Influencer Program
Free TikTok Ads Credit
Master TikTok Ads for Your Business Marketing
Dall-E-OpenAI.com
Generate creative images automatically with AI
chatGPT4.win
Talk to ChatGPT by your mother language
First AI Product from Elon Musk - Grok/UN.com
Speak to Grok AI Chatbot with Your Language
Tooly.win
Open tool hub for free to use by any one for every one with hundreds of tools
GateIO.gomymobi.com
Free Airdrops to Claim, Share Up to $150,000 per Project
iPhoneKer.com
Save up to 630$ when buy new iPhone 16
Buy Tesla Optimus Robot
Order Your Tesla Bot: Optimus Gen 2 Robot Today for less than $20k
Cool Domains for Sale!
Author:
Previews:
Comment:
Votes:
Sent:
Size:
Rank:
Phong Thai [more]
1,611
0
0
0
14.67 KBytes
0 votes / 1,611 previews / 0 comment
23/08/2024
When it comes to interactive data visualization in JavaScript, one of the most critical features is the ability to zoom ...Insights for Advanced Zooming and Panning in JavaScript Charts - Insights for Advanced Zooming and Panning in JavaScript Charts
